This is the second in the series about extreme Java performance; see Part 1 for more information.
In most cases creating objects is not a performance issue and object pooling today is considered an anti-pattern. But if you are creating millions of ‘difficult’ objects per second (so ones that leave a stackframe and potentially leave a thread) it could kill your performance and scalability.
In Multiverse I have taken extreme care to prevent any form of unwanted object creation. In the current version a lot of objects are reused, e.g. transactions. But that design design still depends on 1 object per update per transactional object (the object that contains the transaction local state of an object; I call this the tranlocal). So if you are doing 10 million update transactions on a transactional object, at least 10 million tranlocal objects are created.
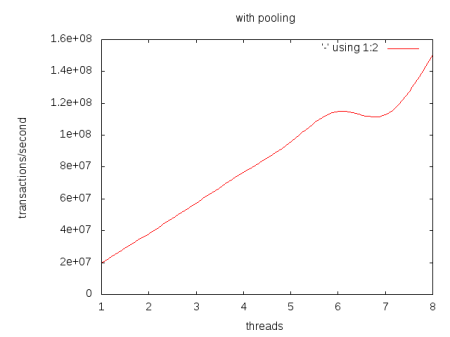
In the newest design (will be part of Multiverse 0.7), I have overcome this limitation by pooling tranlocals when I know that no other transaction is using them anymore. The pool is stored in a threadlocal, so it doesn’t need to be threadsafe. To see what the effect of pooling is, see the diagrams underneath (image is clickable for a less sucky version):
As you can see, with pooling enabled it scales linearly for uncontended data (although there sometimes is a strange dip), but if pooling is disabled it doesn’t scale linearly.
Some information about the testing environment:
Dual cpu Xeon 5500 system (so 8 real cores) with 12 gigs of ram and I’m using Linux 64 bit/Sun JDK 1.6.0_19 64 bits and the following commandline settings:java -XX:+UseParallelGC -XX:+UseParallelOldGC -XX:+UnlockExperimentalVMOptions -XX:+UseCompressedOops -server -da
[edit]
The new diagram without smooth lines. Unfortunately I was not able to generate a histogram in a few minutes time (image is clickable).


 Posted by pveentjer